![]()

We believe that better insights lead to better results! That’s why we equip all PRO level agencies with a highly advanced reporting system to help your agency gain a more holistic understanding of what drives sales.
PRO Level agencies can locate Reports by clicking on Reports from the sidebar navigator within the portal. From there, you can toggle to several different categories and sections to find the data you’re looking for.
Reports include segmentation between your agency’s website and activity within The Lighting Exchange® portal, and are divided into the following categories:
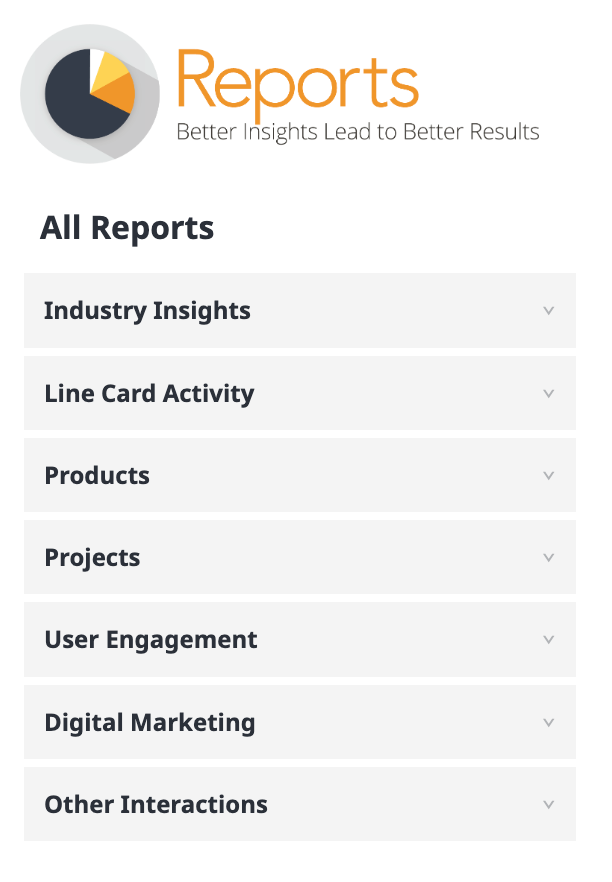
Industry Insights
- Reports in this section reflect big picture data on products, industry trends and nation-wide lighting activity.
Line Card Activity
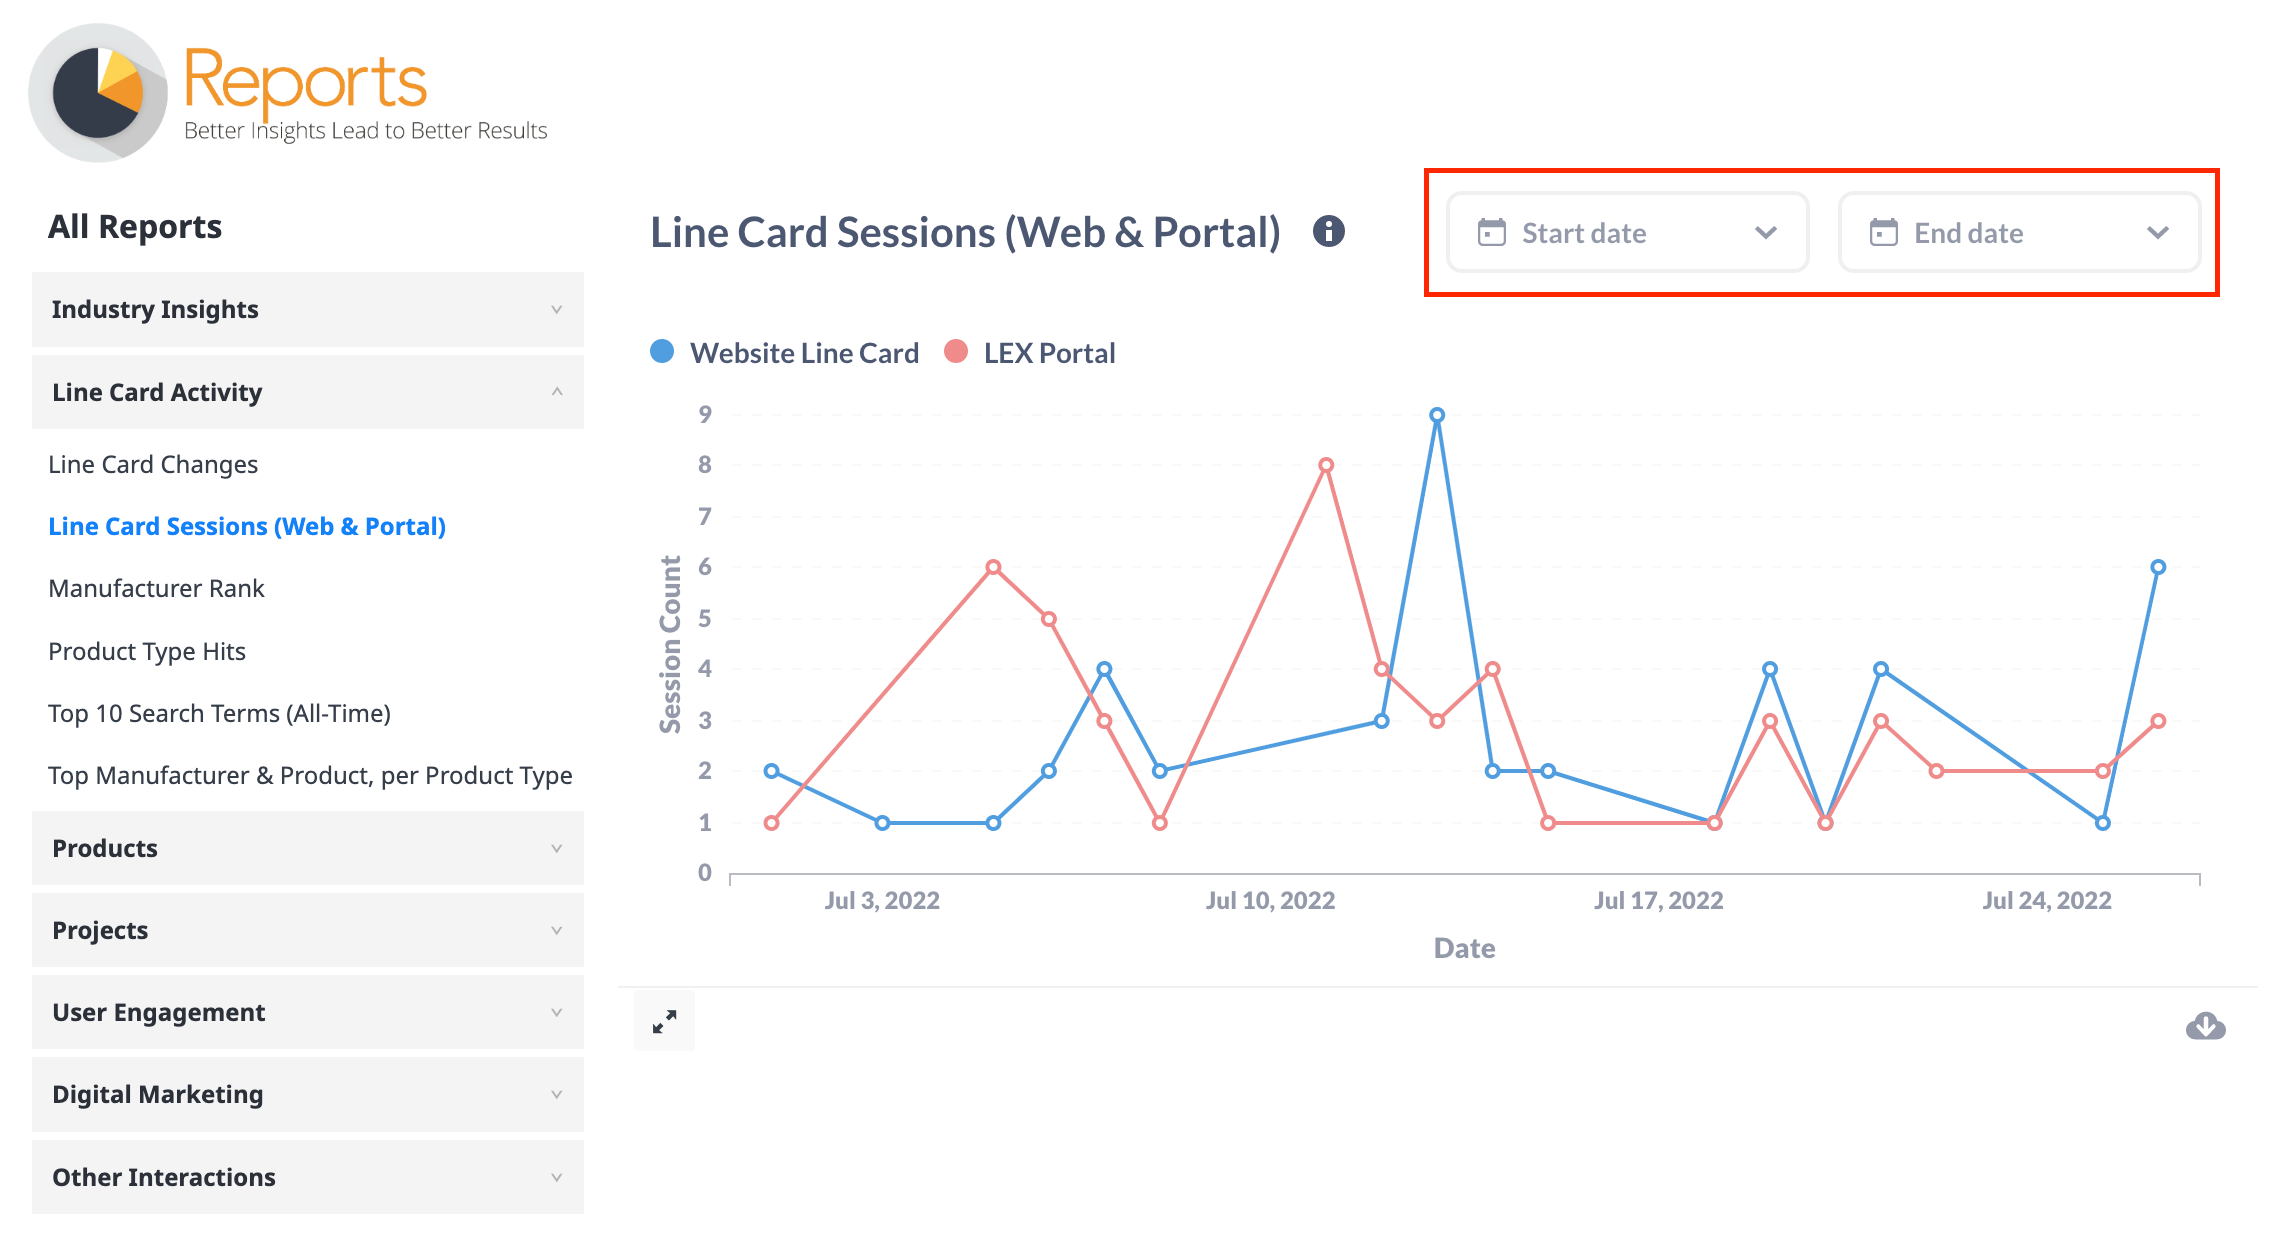
- In this section, reports are specific to your agency’s line card and provide a full picture of trends within the portal and out on your website with high levels of specificity.
Products
- Zero in on new product arrivals, sample management trackers, and top products in the Products report section.
Projects
- In this section, you’ll find analytics on your agency’s recent Project activity and insights on product statuses
User Engagement
- The User Engagement Reports provide insight into your agency team’s engagement within The Lighting Exchange as well as your customers and manufacturers.
Digital Marketing
- Reports in this section showcase the engagement and effectiveness of The Lighting Exchange® digital marketing tools out on your agency’s website.
Other Interactions
- Other Interactions Reports contain data on top viewed collateral displaying within the portal and out on your agency’s website.
Customize Reports with Date Range Selection!
Select reports include dynamic date range selection to allow your team to further segment the data. To select a specific date range for a report, look for the Start Date and End Date buttons, enter in the dates you’d like to view, and the report will update automatically!
Export Reports
Each report can be exported on-demand in three different formats – as a CSV, Excel or JSON file. Simply click on the cloud icon in the bottom right hand corner of each report and select which export format you’d like to download to your computer!

Report Descriptions
Each report includes new interactive visualizations to help users better understand how to read the data. You can hover over the information icon to read each report’s description.

We hope that you and your teammates will find these Reports helpful! Please reach out to our team at [email protected] if you have any questions, or drop us a note in the support chat!